V-Ray Benchmark is Chaos’s free standalone tool that measures rendering speed across CPUs and GPUs running V-Ray, with results uploaded to a public leaderboard. The CPU results appear in vsamples, the GPU results in vpaths, and the benchmark differentiates between CUDA and RTX paths, reflecting how modern NVIDIA hardware accelerates rendering. In 2026, the RTX 5090 leads the GPU leaderboard for single-card rendering (above 3,000 vpaths is solid production territory), followed by the RTX 4090, while a strong CPU workstation scores above 25,000 vsamples. The benchmark is widely used to compare hardware for workstations and to plan cloud V-Ray pipelines for 2026.
This guide covers the three main benchmark tests, how to interpret results across V-Ray 6 and V-Ray 7, and what those numbers imply for cloud rendering efficiency. V-Ray Benchmark ships its own reference scenes and renders them under identical conditions across different hardware configurations, ensuring a fair comparison. At Super Renders Farm, we run V-Ray Benchmark regularly on our farm hardware to establish baseline performance metrics.
What the tests measure and how to read scores
The current V-Ray Benchmark builds include three separate tests, each measuring a different rendering path. The CPU benchmark runs V-Ray's path tracing algorithm on multi-core processors. What the score means: A higher vsamples score indicates faster CPU rendering. Example: A dual-socket workstation with high core count will score significantly higher than a consumer laptop on this test. Real-world correlation: CPU benchmark scores correlate well with actual V-Ray CPU render times, but the relationship is not perfectly linear. Scene complexity, shader count, and geometry detail all affect the final result.
The GPU CUDA benchmark measures NVIDIA GPUs using the CUDA rendering engine. It runs the same scene but on GPU hardware instead of CPU cores. What the score means: This test is useful if you run V-Ray with GPU acceleration enabled on workstations or if you are comparing NVIDIA GPUs for render farm deployment. Example: An NVIDIA RTX 5090 will score much higher on the GPU CUDA test than older GPUs like the RTX 3090. When to use this benchmark: Run the GPU CUDA test if your workflow uses V-Ray GPU rendering on consumer or workstation GPUs.
The GPU RTX benchmark uses the dedicated ray tracing hardware in modern NVIDIA GPUs. Instead of path tracing via CUDA, it uses RTX ray tracing cores for faster, specialized ray intersection. What the score means: This is the most optimized benchmark for modern GPUs. Higher vrays scores indicate faster GPU rendering via RTX acceleration. Example: On our farm, RTX 5090 GPUs run this benchmark with score values that reflect the specialized hardware. Real-world impact: RTX ray tracing often reduces render time per frame by 30-60% compared to CUDA path tracing, depending on the scene.
V-Ray Benchmark tracks the V-Ray product line, so the build you run should match the V-Ray version in your pipeline. V-Ray 6.2 (mature long-support line) pairs with the Benchmark 6.x build, while V-Ray 7 (current major release) brings substantial GPU path changes, updated denoiser, improved AI upscaling, and better volumetric performance. V-Ray 7 Benchmark scores are typically higher than V-Ray 6 on the same hardware, especially on RTX 4000 and 5000 series cards, because the renderer makes fuller use of tensor cores and newer RT cores. Older benchmarks (V-Ray Benchmark 5.x and earlier) use different test scenes and measurement units, so scores from those versions are not comparable to current builds. Always check which benchmark version produced a score before quoting it, especially when referencing third-party hardware reviews.
Interpreting performance and real-world implications
Benchmark scores are useful for relative comparison, but they have limits. A machine that scores high on benchmark might render slower on your specific job if that job has heavy volumetric effects or uses memory-intensive plugins. On our farm, we use V-Ray Benchmark results to evaluate hardware end to end and to guide cloud rendering decisions. A broader look at render farms that support V-Ray can be found in our dedicated roundup. Establish hardware baselines, estimate job completion time, optimize hardware allocation, and communicate performance expectations with clients. When clients ask “will this render faster on your farm?”, we reference our hardware and benchmark comparisons. We operate over 20,000 CPU cores across our farm, primarily dual-socket Xeon processors optimized for sustained multi-frame rendering, and our GPU fleet is standardized on NVIDIA RTX 5090 machines with 32 GB VRAM, the current consumer-class flagship for GPU V-Ray workloads.
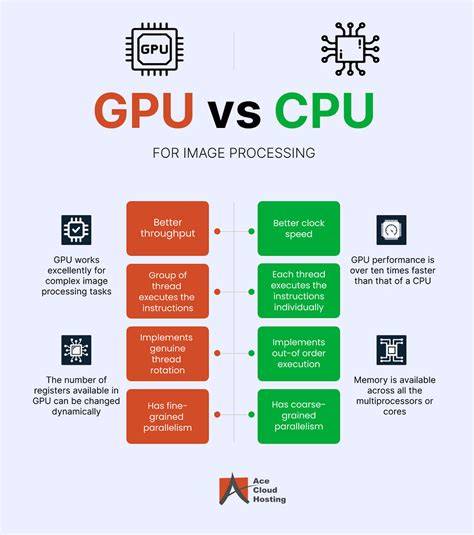
In benchmark terms, CPU vs GPU show different strengths. For single-card GPU rendering, RTX 5090 leads the leaderboard, with RTX 4090 close behind; multi-GPU setups scale near-linearly, where two 5090s render roughly twice as fast as one and four roughly four times. For CPU rendering, high-core-count, multi-socket systems deliver the strongest vsamples scores. In terms of cost-per-frame considerations, cloud rendering costs are typically per-core-minute or per-machine-minute, so estimating total compute minutes and multiply by the per-minute rate yields a workable budget. Benchmark-based cost estimates are approximate but help plan rendering workloads before submission.
Practical benchmarks and workflow guidance
Single-card GPU performance, especially with RTX, is often the practical question in 2026: does it make sense to render locally or move to cloud? If your workflow relies on GPU rendering, a high-end RTX card like the 5090 or 4090 provides strong performance, but cloud rendering allows scaling with dozens of RTX 5090 nodes to finish a 300-frame animation much faster than a single workstation. Cloud rendering also avoids local thermal throttling, per-machine licensing management, and VRAM limitations that can constrain complex archviz and product scenes. Two main paths emerge: keep some workloads local for interactivity and look-dev, and route CPU-heavy jobs and long-running sequences to CPU nodes, while GPU-accelerated frames and sequences run on RTX-optimized GPU nodes in the cloud.
To plan and standardize benchmarking, follow these practices: run the benchmark, note the environment (driver version, OS, V-Ray Benchmark build, BIOS settings like turbo mode, and any power plans), account for CPU throttling and background processes, and re-run on each machine to account for variability. GPU driver versions can shift scores by about 5-10%, and different benchmark builds (V-Ray 6 vs V-Ray 7) influence scores. When comparing two machines, run the benchmark at least twice on each to ensure variability is accounted for.
Our rules of thumb for 2026: a single RTX 5090 can lead the GPU leaderboard for single-card rendering, while a strong dual-socket or high-end Threadripper CPU workstation exceeds 25,000 vsamples on the CPU benchmark. For two or more GPUs, V-Ray GPU scales near-linearly, but not perfectly, so plan for diminishing returns per additional card beyond two. Overall, V-Ray Benchmark remains a powerful tool for understanding hardware performance, budgeting cloud rendering, and optimizing job scheduling across a rendering pipeline.
Reference data and practical examples
Scenario: You have a 3ds Max + V-Ray scene that renders one frame in 45 minutes on your workstation. Your workstation hardware scores approximately 1,500 vsamples on V-Ray CPU Benchmark. This is a rough estimate; actual time depends on scene overhead, plugin complexity, and job queue wait time. If render time is predictable via benchmark, then cost becomes calculable. Find our pricing. Cloud rendering cost is typically per-core-minute or per-machine-minute. Estimate total compute minutes by taking your estimated per-frame time and multiplying by frame count, then multiply machine-minutes by the per-minute rate. Costs vary by machine type (CPU vs GPU), so check the pricing page for your specific use case. Benchmark-based cost estimates are approximate, but they let you budget render jobs before submission.
For context, a single consumer RTX 5090 or RTX 4090 can deliver strong GPU performance in the CUDA and RTX tests, while multi-GPU rigs expand throughput, albeit with near-linear scaling that may slow with additional cards. The CPU benchmark provides a complementary view, highlighting how high-core-count workstations handle complex scenes and long render times. In all cases, align the benchmark version with your pipeline’s V-Ray version (6.x vs 7.x) to avoid misinterpretation of results.
- CPU test vsamples measure CPU render speed using V-Ray’s production renderer.
- GPU CUDA test vsamples measure GPU render speed using the CUDA engine.
- GPU RTX test scores reflect RTX-accelerated ray tracing performance.
- Results should be interpreted in the context of your scene complexity and software setup.
- Run the benchmark, record results, and submit to the public leaderboard if you wish to compare with others.
- If you are weighing a second card, examine multi-GPU scaling data to understand practical gains.
- When planning cloud rendering, convert per-frame times to total compute minutes and multiply by the cloud rate.
Hardware profile used in many demonstrations includes dual-socket Xeon-based CPUs and an RTX 5090 GPU fleet, representative of a high-end production environment for archviz and product visualization. The standalone V-Ray Benchmark app is free to download from Chaos (chaos.com/vray-benchmark) and does not require a V-Ray license; it ships with its own renderer and reference scenes for Windows, macOS, and Linux.