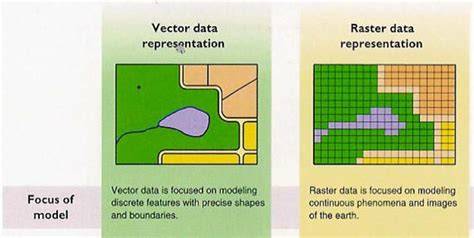
Understanding raster and vector data is fundamental in the world of GIS. These two data formats are the building blocks of spatial analysis, each offering unique advantages for representing and analyzing geographic information. But what exactly is raster and vector data, and what are the differences between the two? This article aims to answer these questions. In short, you can begin to think about them like this: raster data is like a photograph made up of pixels, with each pixel storing specific information such as color, temperature, or elevation; making it ideal for continuous data. Vector data, on the other hand, is like a drawing where points, lines, and polygons are used to represent features; perfect for mapping discrete elements like roads and property boundaries.
Why it's important to know the difference between raster and vector data
Knowing the difference between raster and vector data is crucial for several reasons:
- Having the right output for the job - Different GIS tasks require different types of data. For instance, terrain analysis and remote sensing often use raster data, while urban planning and transportation modeling typically rely on vector data. Understanding which type of data is appropriate for a given task ensures the best results.
- Data visualization - The way data is visualized in GIS depends on whether it is raster or vector. Raster data provides detailed images, while vector data offers clear, precise representations of boundaries and networks. Knowing the difference allows you to create more effective and informative visualizations tailored to your needs.
- The type of analysis and insights needed - Different types of spatial analysis require different data models. Raster data is suitable for analyses involving continuous surfaces, such as slope or temperature gradient analysis. Vector data is better for network analysis, like finding the shortest path between points or managing utility networks. Using the appropriate data type ensures accurate and relevant analysis outcomes.
- Data storage and management - Raster data, due to its pixel-based structure, can become very large, especially at high resolutions. Vector data, on the other hand, tends to be more storage-efficient for mapping discrete features. Knowing the differences helps in managing data storage efficiently and making informed decisions about data resolution.
Let’s explore what each of these data types are in more detail.
Raster data
Raster data is made up of pixels (tiny squares), each representing a specific area on the Earth's surface. The size of each pixel, known as the Ground Sampling Distance (GSD), determines the resolution of the raster data. A smaller GSD means higher resolution and more detail, while a larger GSD means lower resolution and less detail. Each pixel has a value that represents information, such as color, elevation, or temperature.
Characteristics of raster data
- Grid-based: Composed of rows and columns of pixels, similar to a digital photo.
- Continuous data representation: Suitable for representing continuous phenomena like elevation, temperature, and land cover.
- Resolution: Defined by the size of the pixels; higher resolution means smaller pixels and more detail.
Types of raster data
- Elevation models (DEM, DTM): Raster data representing elevation values across a terrain surface. Digital Elevation Models (DEM) and Digital Terrain Models (DTM) are examples used for terrain analysis, flood modeling, and viewshed analysis.
- Orthophotos (Orthomosaics): High-resolution, georeferenced raster images created by stitching together aerial photographs. Orthomosaics are corrected for distortions caused by terrain relief and camera perspective, used for accurate mapping, land use planning, and environmental monitoring.
- Satellite imagery: Raster data captured by satellites, providing visual representations of the Earth's surface. Used for monitoring land cover changes, agricultural assessments, and urban planning.
- Land cover and land use maps: Raster datasets categorizing types of land cover (e.g., forest, urban, water) or land use (e.g., residential, commercial, agricultural).
- Climate and weather data: Raster datasets capturing meteorological variables such as temperature, precipitation, and humidity, used in climate modeling and environmental studies.
Raster Data Formats
- GeoTIFF (.tif) - A widely used format for georeferenced raster images, supporting both spatial data and metadata.
- JPEG (.jpg) - Commonly used for compressed photographic images, though not typically used for GIS analysis due to lossy compression.
- PNG (.png) - Raster format that supports transparency and lossless compression, suitable for web-based mapping and GIS applications.
Vector data
Vector data represents geographic features using points, lines, and polygons, defined by x, y, and sometimes z coordinates to include elevation or height information. Unlike raster data, which is grid-based, vector data provides precise spatial representations.
Characteristics of vector data
- Coordinate-Based: Uses x, y, and optionally z coordinates to define the shape and location of features, allowing for three-dimensional representation.
- Discrete Data Representation: Ideal for representing discrete features like roads, property boundaries, and landmarks.
- Scalability: Vector data can be easily scaled without losing detail, making it suitable for maps of various scales.
Types of vector data
- Points: Vector data representing discrete locations defined by x, y coordinates. Used for mapping specific features like landmarks, wells, or monitoring stations.
- Lines (Polylines): Vector data representing sequences of points connected by straight or curved segments. Used for mapping features such as roads, rivers, and pipelines.
- Polygons: Vector data representing enclosed areas defined by a series of connected points. Used for mapping features like administrative boundaries, land parcels, and lakes.
- Networks: Vector data representing interconnected sets of points and lines, used for modeling transportation networks (roads, railways), utility networks (electricity, water), and communication networks.
- Contours: Vector data derived from raster DEMs, representing lines connecting points of equal elevation. Used for terrain visualization, engineering design, and landscape analysis.
Vector data formats
- Shapefile (.shp) - A popular vector format consisting of multiple files (.shp, .shx, .dbf) that store geometric and attribute data.
- GeoJSON (.geojson) - A format for encoding a variety of geographic data structures using JavaScript Object Notation (JSON).
- KML/KMZ (.kml, .kmz) - Keyhole Markup Language and its compressed counterpart, used for displaying geographic data.
Comparing raster and vector data
Raster and vector data formats each have distinct characteristics suited for different types of spatial data and analysis tasks.
- Raster: Grid-based format with each cell holding a single value; Vector: Coordinate-based format using points, lines, and polygons. - Raster: Higher resolution provides more detail but increases file size; Vector: Maintains precision at any scale, making it excellent for detailed mapping.
Both raster and vector data are essential components of GIS, each with their unique strengths and applications. Raster data excels in representing continuous phenomena and providing detailed imagery, while vector data is perfect for mapping discrete features and enabling precise analyses. GIS systems utilize two basic data types: raster and vector. Despite their apparent simplicity, the choice between them directly impacts analysis results, calculation accuracy, and ease of use. Mistakes at this stage can lead to incorrect conclusions or unnecessarily complicate a project. Therefore, it's important to understand not only the differences between these formats but also their practical applications.
What is raster data? Raster data is a regular grid of cells, where each cell contains a specific value. These values can describe various surface characteristics, such as elevation, temperature, humidity, or vegetation status. Essentially, a raster is a way to represent a continuous surface digitally. Example of raster data: satellite image of Dubai. Classic examples include satellite images, digital elevation models (DEMs), climate maps, and various indices such as NDVI. A key feature is that values change gradually from one cell to the next, reflecting real-world natural processes. The quality of raster data depends on its resolution. The smaller the pixel size, the more detailed the information, but the greater the data volume and processing load.
What is vector data? Vector data describes individual objects with clear boundaries. It is represented as geometries: points, lines, and polygons, and is usually accompanied by attribute information. Example: New York City's administrative divisions. This structure makes vector data convenient for describing infrastructure and administrative boundaries. For example, roads, buildings, rivers, districts, and cities are almost always represented in vector format. The main advantage of vectors is precision. Object boundaries are defined by coordinates, enabling precise measurements and analysis.
When to use each data type
Key differences show when to apply rasters vs. vectors:
- Raster is better for analyzing natural processes and continuous phenomena but requires more memory and depends on resolution.
- Vector is better for discrete features, scalable without increasing file size, and precise when boundaries matter.
When to Use Raster? Raster data is used when working with continuous values such as temperature, precipitation, elevation, or vegetation condition. Raster is also widely used with satellite data to classify surfaces, analyze changes over time, and calculate indices. It is indispensable in modeling processes such as forest fire spread, water movement, or climate change. A flood risk raster for Cardiff, for example, shows a continuous phenomenon where gradual changes are expected across nearby cells.
When to Use Vector? Vector data is used when it is important to describe individual objects like a transportation network, buildings, territorial boundaries, or points of interest. Tasks requiring precision and a clear data structure include network analyses, routing, logistics, and geomarketing. The vector format underpins networks and precise measurements essential for planning and operations.
Combining Raster and Vector
In practice, most projects use both data types simultaneously. For example, you can analyze a vegetation index (raster) within administrative boundaries (vector) or compare climate data with populated areas. Operations such as layering, value extraction, or data clipping allow you to combine different formats and obtain more accurate results. The combination of raster and vector data offers the greatest flexibility in analysis.
Typical Mistakes
- Using the wrong format for the task - analyzing continuous processes with vector data or using rasters to describe individual objects.
- Choosing the wrong resolution or using excessive detail, which complicates the work without providing real benefits.
Spatial data structures and practical notes
Spatial data types provide the information required to reconstruct the spatial data in digital form. In the raster world, we have grid cells representing real-world features. In the vector world, we have points, lines, and polygons that consist of vertices and paths. Vector and raster data both have their advantages and disadvantages. But you can convert vector to raster and vice versa. Spatial Indexes are global grids that render like vector data and are used for both vector-based analysis and raster-based analysis, offering speed and efficiency for big spatial data.
Land id showcases working with both data types, offering seven base layers and over 40 preloaded GIS layers. Importing geographic files, styling, labeling, and sharing maps are streamlined, with automatic labeling and intuitive tools designed for experts and beginners alike. This makes it possible to build polished, professional maps without a traditional GIS background.